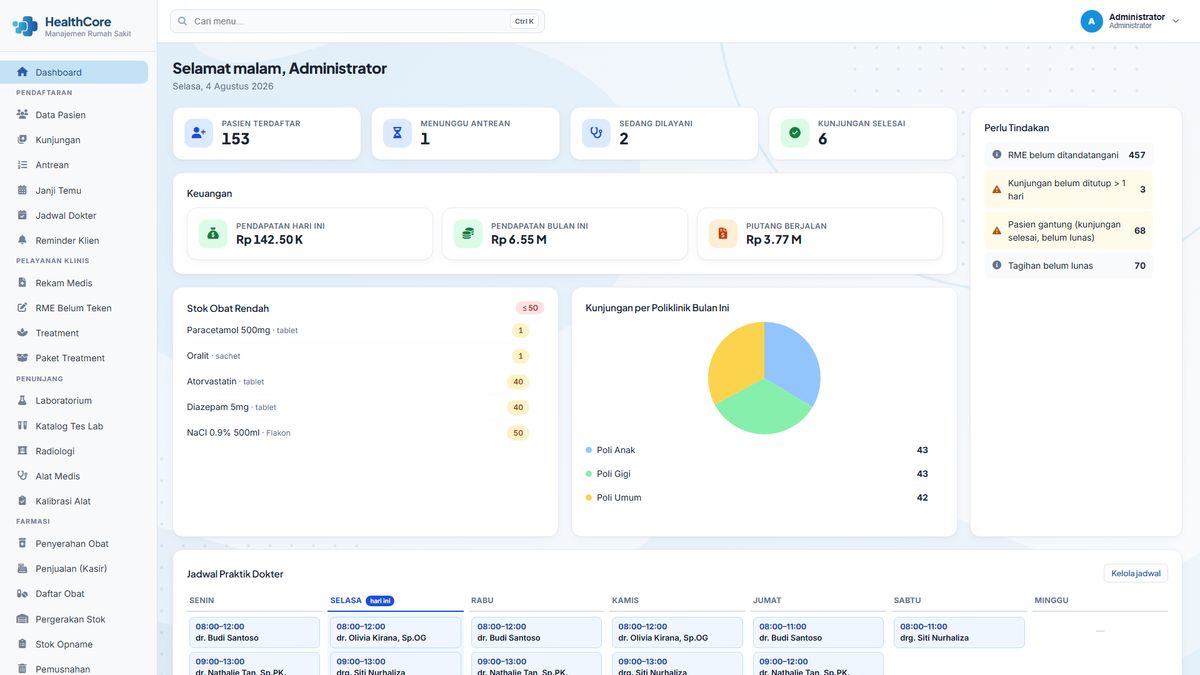
SIMRS Dashboard & Forecasting Module: Operational Visibility and Prediction
The Dashboard & Forecasting module is management’s window into the facility’s entire operation. Instead of summarizing from many manual reports, management sees summaries updated from operational data (patients, stock, and invoices) and reads trends that support faster decisions.
Patient, low stock, and invoice summary
The dashboard shows the main summary in one screen: patient visits, low medicine stock, and invoice status. Operational signals usually scattered across several modules (how many patients today, which medicine is nearly out, which invoices are still open) can be read at a glance from one view, so small problems are handled before they become big ones.
Revenue reports by clinic and period
Revenue reports can be prepared per clinic and per period, so management sees each service unit’s contribution to facility revenue. Period-over-period comparisons help assess service trends and plan capacity, not just record what already happened.
Moving Average forecasting and accuracy tests
The module performs forecasting with the Moving Average method (MA-3 through MA-6) to estimate visits or operational needs for the next period. What sets it apart from a simple guess: forecast results are tested for accuracy with metrics such as MAE, RMSE, and MAPE, so management knows how reliable the estimate is before using it for decisions.
Supports facility performance monitoring
These summaries and forecasts are used to monitor facility performance regularly: service load, medicine availability, and revenue. Because the same data is used across all modules, management reports do not need to be manually assembled every month.
Who uses this module
Management and facility owners use the dashboard for daily monitoring and planning; unit heads see their unit’s summary; and admins use reports for administrative needs. Access is role-based so strategic information is only visible to authorized parties.
One data set, one flow
The dashboard does not collect data itself. It reads data already recorded in other modules. Visits from registration and queues, stock from pharmacy, invoices from billing, and trails from audit logs appear as summaries management recognizes. Because summaries are built from the same operational data, dashboard numbers never contradict the reports of the originating modules, and management decisions are based on one version of the truth.
Getting started with this module
The module can start from the facility’s core needs first, then grow in phases. In line with HealthCore’s implementation principles. In the early phase, the facility team uses the dashboard to monitor flows already running (for example visits and invoices) before expanding into forecasting and deeper analytics. Role-based training, go-live support, and data migration are quoted separately from subscription pricing, so the facility starts from the highest-impact flow without changing every process at once.
Summaries you can act on
One thing that separates a useful dashboard from a collection of numbers is how easily it is read in a busy situation. Dashboard summaries are designed to answer recurring operational questions: how many patients are still queued, which medicine needs to be ordered soon, and which invoices need follow-up. When a number needs deeper inspection, management can trace from the summary to the related module reports, so context is not lost between two different views.